
Calculating customer lifetime value is pretty straightforward on the surface: you multiply your average customer value by their average lifespan with your brand. But the number you get back is incredibly powerful. It represents the total revenue you can realistically expect from a single customer over the entire course of their relationship with you.
Why Customer Lifetime Value Matters for Growth

Sure, metrics like monthly revenue and conversion rates give you a snapshot of your business's health right now, but they don't tell the whole story. Customer Lifetime Value (CLV) offers a much-needed, forward-looking perspective. It fundamentally shifts your focus from chasing one-off sales to building genuinely profitable, long-term customer relationships. Think of it as the strategic compass pointing your business toward sustainable growth.
Knowing your CLV isn't just some academic exercise for the finance team. It has a direct, tangible impact on your most critical business decisions. Once you know what a customer is actually worth over time, you can make much smarter choices about how much you should invest to acquire new ones in the first place.
CLV isn’t just another metric to stick on a dashboard; it's a strategic tool. It transforms your entire approach from simply making sales to building valuable, long-term assets for your company.
Informing Smarter Business Strategies
When you get a handle on your customer lifetime value, you start to unlock insights that ripple across your entire business. This knowledge lets you move past gut feelings and start basing your strategies on cold, hard financial data.
A clear picture of your CLV helps you:
- Optimize Marketing Spend: You can finally determine exactly how much you can afford to spend on acquiring a new customer while still turning a profit.
- Improve Customer Retention: It helps you spot your most valuable customers, making it easier to develop targeted loyalty programs that keep them happy and engaged.
- Guide Product Development: You can pinpoint which products or services your high-value customers love most, which directly informs future improvements and innovations.
- Enhance Personalization: Segmenting your audience based on their potential value allows you to tailor marketing messages and offers for maximum impact.
For any business operating in the competitive UAE market, these data-driven decisions are absolutely essential. The regional loyalty programs market is set to explode to $5.49 billion by 2029, growing at a compound annual rate of 13.8%. This rapid expansion shows just how critical it is for major players like Carrefour and Al-Futtaim to use CLV to sharpen their customer retention efforts.
It’s a known fact that omnichannel shoppers have a 30% higher lifetime value, making precise CLV calculation fundamental for driving profitability in this digital-first economy. For a deeper look at the Middle East's loyalty market, you can check out the full analysis on Businesswire.
A Foundation for Sustainable Success
Ultimately, a strong focus on CLV fosters a customer-centric culture throughout your organization. It gets every department—from marketing to customer service—to think about how their day-to-day actions contribute to building lasting, profitable relationships. For new businesses, embedding this mindset from day one is absolutely key. It’s a core part of building a successful digital marketing strategy for startups.
By treating CLV as a primary KPI, you ensure your business isn't just surviving, but actually thriving. You end up building a more resilient company that can easily weather market ups and downs because its growth is built on a solid foundation of loyal, profitable customers. This strategic shift is what separates short-term gains from long-term market dominance.
Diving In: What Data Do You Need for CLV?
Before you can unlock the power of Customer Lifetime Value, you have to get your hands on the right data. Think of it like cooking: the final dish is only as good as the ingredients you start with. The same principle applies here—the accuracy of your CLV hinges entirely on the quality of the numbers you pull.
The good news? You don’t need to be a data scientist to find what you need. Most of this information is probably sitting right inside the tools you already use every day. Your e-commerce platform like Shopify, your Customer Relationship Management (CRM) software, or even your basic billing system are all treasure troves of customer data.
The trick is knowing what to look for and making sure it’s clean. A little bit of prep work now saves a ton of headaches later and ensures your final CLV figure is one you can actually trust.
The Core Metrics You'll Need to Source
To get a solid, practical CLV number, you really only need to track down three key pieces of information. These metrics are the building blocks of almost any CLV model and, together, they paint a clear picture of your customers' buying habits and loyalty.
Here are the data points you'll want to find:
- Average Purchase Value (APV): This is simply how much a customer spends, on average, every time they place an order. It’s a direct reflection of your pricing and how much value customers see in a single transaction.
- Purchase Frequency (F): This tells you how often your average customer comes back to buy from you over a specific timeframe (like a year). It’s a fantastic indicator of customer engagement and how integrated your brand is into their life.
- Average Customer Lifespan (L): This measures the average amount of time a customer stays active before they go dark or "churn." It’s one of the most powerful signals of customer loyalty and satisfaction you can have.
My biggest piece of advice here is to be consistent. Decide on a time frame for your analysis—whether it's the last year, the last six months, or a specific quarter—and stick to it for all your calculations. Mixing and matching time periods is a surefire way to get skewed, unreliable results.
To make things even easier, I've put together a quick-reference table that breaks down exactly what these metrics are and how you can calculate them from your own data. Getting these numbers organized first will make the actual calculation a breeze.
Core Metrics for CLV Calculation
| Metric | Definition | How to Calculate It |
|---|---|---|
| Average Purchase Value | The average dollar amount of a single customer's order. | Total Revenue / Total Number of Orders |
| Purchase Frequency | The average number of purchases a customer makes in a given period. | Total Orders / Total Unique Customers |
| Average Customer Lifespan | The average time a customer continues to buy from your brand. | Average the time between the first and last purchase for all customers. |
Once you have these three numbers pulled together, you've done the hardest part. You’re now ready to plug them into a formula and see what your customer lifetime value truly is.
Choosing the Right CLV Calculation Model

So, how do you actually calculate customer lifetime value? It's not a one-size-fits-all answer. The right method really boils down to what you're trying to accomplish. Are you looking for a quick, high-level snapshot to gauge your business's health? Or do you need a much deeper, more detailed forecast to steer your strategy for the months and years ahead?
Your decision will lead you down one of two main paths: the Historical model or the Predictive model. Each gives you a different kind of insight, and the best fit depends on the data you have, the resources your team can spare, and what you ultimately want to achieve.
Let’s walk through both so you can make the right call for your business.
The Historical CLV Model
This is your starting point. The historical model is the most direct way to figure out customer lifetime value because it only uses data you already have. It looks backward at past purchases to tell you what a customer has been worth to your business up to this exact moment. It’s simple, easy to get started with, and you won’t need any fancy statistical software.
Think about it this way: imagine you run a local coffee shop. You have a regular who comes in every week and spends about AED 30. They’ve been doing this for the last two years. Calculating their historical CLV is just a matter of adding up what they've spent. You're simply looking at their purchase history.
This approach is perfect for small businesses or teams who are just beginning to explore CLV. It gives you a solid, reliable baseline for understanding customer value without needing a dedicated data science department.
The catch? Its biggest limitation is that it assumes the future will be an exact replica of the past. It can’t account for shifts in customer behavior, new market trends, or how your latest marketing campaign might change things.
Key takeaway: The historical model is fantastic for a quick health check and for any business with limited data. It tells you what has already happened, which is the essential first step in understanding what your customers are worth.
The Predictive CLV Model
Now, this is where things get really powerful. The predictive CLV model doesn't just look at past transactions. It also weaves in behavioral patterns and uses statistical algorithms to forecast a customer's future value. It's a forward-looking method that tries to answer the million-dollar question: "What is this customer likely to be worth to us down the road?"
Predictive models are, by nature, more complex. They might analyze variables like:
- How recently a customer bought something.
- How often they make a purchase.
- The specific product categories they browse or buy from.
- Their history of interactions with your customer support team.
For instance, a subscription-based SaaS company in Dubai could use a predictive model to spot customers showing early warning signs of churn, like low feature usage. On the flip side, it could also identify which customers are prime candidates for an upsell to a more expensive plan. This allows you to be proactive—something the historical model simply can't do.
While this approach gives you far more actionable insights for things like customer segmentation and personalization, it does demand more from you. You'll need more data and more analytical firepower. This might mean investing in specialized software or bringing in team members who have experience with data analysis. But when you consider that increasing retention by just 5% can boost profits by a staggering 25% to 95%, the investment in predictive modeling can pay for itself many times over.
Ultimately, the goal is to pick the model that aligns with your current capabilities and strategic needs. There's no shame in starting with the historical model. You can always "graduate" to a predictive one as your business—and your data maturity—grows.
Putting CLV to Work: A Real-World Calculation
The theory and formulas are great, but the real magic happens when you roll up your sleeves and apply them to actual numbers. Let's walk through a complete CLV calculation from start to finish to see how these pieces fit together.
We'll use a fictional UAE-based subscription company, "Desert Delights," that sends out curated boxes of gourmet dates and sweets. They want to calculate their historical CLV for the past year to get a solid baseline for how much their customers are worth.
This infographic breaks down the basic flow we'll follow, showing how the core metrics combine to give us our final number.
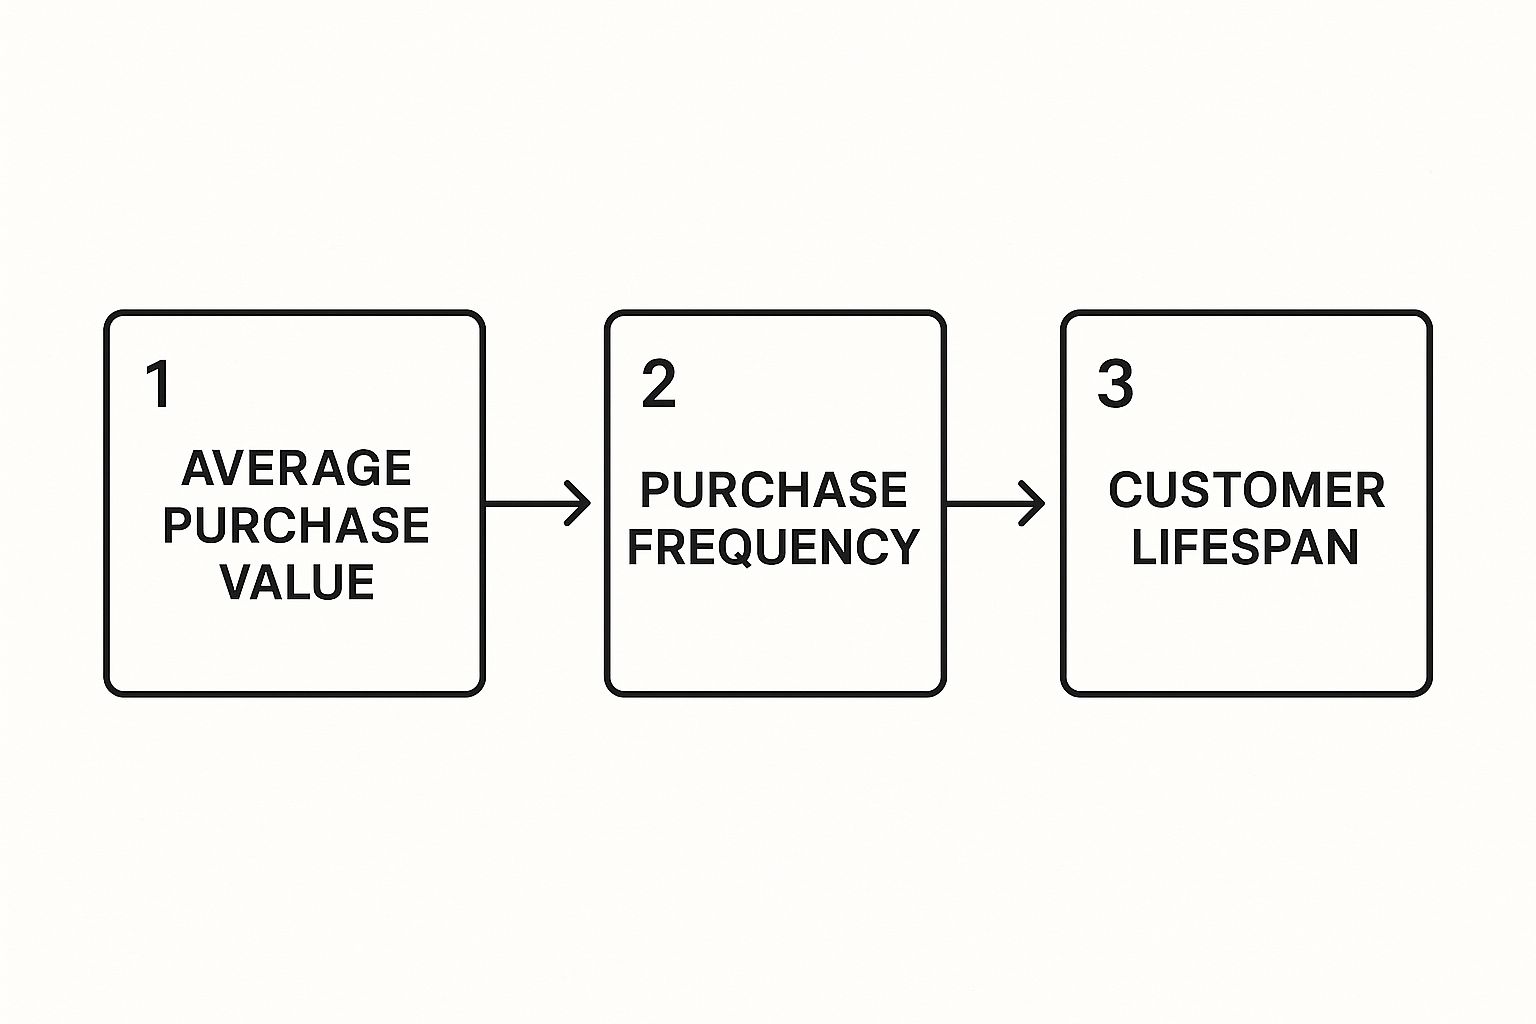
As you can see, it all comes down to combining average purchase value, how often customers buy, and how long they stick around.
Finding the Average Purchase Value
First things first, Desert Delights needs to pin down how much a typical customer spends in a single transaction. Looking at their books for the last year, they see a total revenue of AED 900,000. In that same timeframe, they fulfilled 6,000 individual orders.
The math here is pretty straightforward:
- Formula: Total Revenue / Total Number of Orders
- Calculation: AED 900,000 / 6,000 Orders = AED 150
That gives us an Average Purchase Value (APV) of AED 150. This single figure is powerful—it tells them exactly what the average order is worth.
Determining the Purchase Frequency
Next, we need to know how often a customer comes back to buy more. Desert Delights saw that those 6,000 orders were placed by 1,500 unique customers over the year. This lets them calculate how many times the average person ordered from them.
Here's how they find their Purchase Frequency (F):
- Formula: Total Orders / Total Unique Customers
- Calculation: 6,000 Orders / 1,500 Customers = 4
So, the average customer makes four purchases per year. Now we're getting somewhere. We can use this and our APV to figure out how much revenue a single customer brings in annually.
Customer Value (Annual): This is just the Average Purchase Value multiplied by the Purchase Frequency. For Desert Delights, that's AED 150 x 4 = AED 600. This means the average customer generates AED 600 in revenue each year.
Calculating the Average Customer Lifespan
The final piece of the historical CLV puzzle is the Average Customer Lifespan (L). After digging into their customer data, Desert Delights discovered that, on average, a customer stays subscribed for 2.5 years before they churn and stop their service.
With all three components in hand, they can finally calculate their historical Customer Lifetime Value.
- Formula: Customer Value x Average Customer Lifespan
- Calculation: AED 600 x 2.5 Years = AED 1,500
The historical CLV for a Desert Delights customer is AED 1,500. This isn't just a number; it's a critical benchmark. It tells the team precisely what an average customer is worth over their entire relationship with the company. For anyone wanting to see more examples, this a comprehensive guide on how to calculate Lifetime Value (LTV) for your ecommerce business offers some great additional walkthroughs.
In the UAE, these calculations are especially potent when you consider loyalty program data. Research shows that over 50% of consumers in the Middle East and Africa are active in loyalty schemes, largely driven by the appeal of freebies and exclusive perks. With consumer spending in the MEA region projected to grow at a 4% CAGR through 2040, this kind of engagement is a massive engine for repeat business and, consequently, a higher CLV.
Putting Your CLV Insights into Action
Figuring out your Customer Lifetime Value is a huge milestone, but the number itself is just the starting line. The real magic happens when you turn that data into smarter, more profitable business strategies. It’s time to shift gears from calculation to application.
A powerful first move is to segment your customers based on their CLV. Think of it as sorting your audience into distinct tiers—high-value, medium-value, and low-value. This simple act of categorization helps you break free from one-size-fits-all marketing and start tailoring your approach. Your high-value customers, for instance, have earned a premium experience, whether that means exclusive offers or white-glove support.
Your CLV data isn’t just a report; it’s a roadmap. It shows you exactly who your best customers are and provides clear directions on how to find more people just like them.
This segmentation has a direct ripple effect on how you acquire new customers. Once you know what a great customer is truly worth, you can finally set a realistic ceiling for your Customer Acquisition Cost (CAC). You’re no longer guessing how much to pour into different marketing channels; you can invest with confidence, knowing which ones deliver the most profitable, long-term relationships.
Optimizing Marketing and Retention Efforts
With your customer segments clearly defined, you can start refining your strategies with surgical precision. This is the point where CLV insights connect with real-world actions that actually boost your bottom line. Having solid marketing campaign tracking is critical here, as it lets you measure which channels are magnets for high-CLV customers.
Here are a few ways to put your findings to work:
- Tailored Marketing: Launch specific campaigns for each segment. Your high-CLV group might be highly receptive to loyalty programs, while a low-value segment could be reactivated with a compelling, can't-miss offer.
- Smarter Retention: Concentrate your retention efforts on the medium- and high-value tiers. A small improvement in keeping these customers happy can have a massive financial impact—far more than trying to salvage every low-spending customer.
- Informed Product Development: Dive into the purchase history of your best customers. What are they buying over and over? Use these clues to guide decisions on new product features or service enhancements.
Here in the UAE, you can see this in action in the hyper-competitive telecommunications and retail sectors. Leading companies use CLV analytics to personalize customer experiences, often folding in metrics like cross-sell rates and customer satisfaction scores to enrich their models. For a telecom provider, even a small bump in upselling can drastically increase CLV—a strategy that hinges entirely on understanding who their most valuable customers are. For a deeper look, check out this personalisation imperative report from Strategy& Middle East to see how these insights fuel growth.
Once you calculate customer lifetime value, the next logical step is to apply what you’ve learned. For an excellent resource on turning CLV into business growth, this guide to increasing customer lifetime value is incredibly helpful. Ultimately, acting on your data is what transforms a simple metric into a powerful engine for sustainable success.
Frequently Asked Questions About CLV
As you start working with CLV, a few questions almost always pop up. It's totally normal. Getting a handle on these key points early on is the best way to make sure you're using this metric to its full potential. Let's walk through some of the most common queries I hear from businesses just learning how to calculate customer lifetime value.
What Is a Good CLV to CAC Ratio?
This is probably the most common question, and for good reason. It gets right to the heart of profitability. The big question is always how CLV stacks up against your Customer Acquisition Cost (CAC). While every industry is a bit different, a healthy CLV to CAC ratio is generally considered to be 3:1.
Think of it this way: for every single dirham you spend to bring a new customer in the door, you should get at least three dirhams back over the course of their relationship with you.
- A ratio below 1:1 is a major warning sign. You're actively losing money on every customer you acquire.
- A ratio of 5:1 or higher sounds amazing, but it might actually mean you're not investing enough in marketing. You could be growing much faster.
This ratio becomes your North Star for setting marketing budgets and making sure your growth is actually profitable. For a deeper dive into building a budget that fuels smart growth, getting some expert perspective on digital marketing in the UAE can be incredibly valuable.
How Often Should I Calculate CLV?
There's no need to run the numbers every day—that would be overkill and wouldn't really show you anything meaningful. The right cadence really depends on your business model and how long your typical sales cycle is.
As a solid rule of thumb, recalculating your CLV on a quarterly or semi-annual basis works for most businesses. This is frequent enough to catch important shifts in customer behavior or market trends without getting lost in the weeds of constant analysis.
If your business has a very long sales cycle—say, high-end B2B services—then an annual calculation might be all you need. The key isn't the exact frequency, but the consistency. Track it over time to see if your strategies are actually increasing the long-term value of your customers.
Should I Use Historical or Predictive CLV?
This really comes down to your immediate goals and the resources you have at your disposal.
Historical CLV is the perfect place to start. It’s much simpler to calculate because it's based on past, known data. This gives you a firm, reliable baseline of what your customers have been worth to you.
Predictive CLV, on the other hand, is the more advanced play. It uses behavioral patterns and trends to forecast future value. It's definitely more complex, but the insights are far more powerful for making proactive decisions about your marketing and customer retention efforts.
My advice? Start with historical CLV to get your bearings. As your team and your data skills grow, you can then move toward a predictive model to really sharpen your strategy.
Ready to turn these insights into measurable growth? Technogital F.Z.C is a full-service digital marketing agency that helps businesses like yours use data to drive real results. From SEO to social media, we build strategies that increase your online visibility and boost your bottom line.
Visit us at https://www.technogital.ae to learn how we can help you grow.